
Chester County residents checking the East Branch Brandywine Creek below Downingtown can see water levels, sensor readings and an estimate of E. coli on the same USGS website. Those numbers come from different processes. The bacteria estimate is calculated from other measurements, rather than a new laboratory test each time the graph changes.
The station’s equipment records and published model explain what the online display can tell readers, and where its limits begin.
Sensors record the stream, then send data by satellite
The USGS station below Downingtown is on the East Branch Brandywine near Sugars Bridge, southeast of the borough. Its public page offers separate graphs for water temperature, turbidity, specific conductance and other measurements.
The station’s model archive, page 1, describes a YSI EXO2 instrument installed in August 2022 to replace an older sensor unit. Readings are recorded every 15 minutes and transmitted hourly by satellite. That distinction matters when checking a timestamp: collection and transmission are separate steps.
The archive also records changes in what the site measures. Measurements of pH and dissolved oxygen were discontinued after September 2024. A historical graph therefore does not establish that every listed measurement is still being collected.
How the E. coli estimate is calculated
The Downingtown model, page 4, uses turbidity, specific conductance and seasonal terms based on the day of the year to estimate bacteria concentrations.
Turbidity measures water clarity. Specific conductance describes the water’s electrical conductivity. These are inputs to a statistical relationship, not a continuous count of bacteria passing a sensor.
USGS developed the model using paired bacteria samples and stream measurements from 2019 through 2024. Its calibration summary, page 2, says the final regression used 51 paired observations. The bacteria samples were collected from the stream and processed at the USGS laboratory in Downingtown.
The model documentation cautions that accuracy may be limited outside the period and range of conditions used to develop it. The county’s Healthy Streams and Recreation page adds that estimates may differ from actual bacteria concentrations and from conditions upstream or downstream.
The seasonal notices need a closer look
The county page says estimated bacteria concentrations are available from March 15 through October 15. The Downingtown model archive instead identifies April 1 through October 31 as its application period.
During an October 28, 2026 check, the station’s E. coli graph displayed an estimate timestamped 5:45 a.m. Eastern that day and marked the data provisional. The records therefore show different seasonal windows, while the station was still displaying estimates after October 15. The reason for that difference is not established by the records reviewed.
For a current check, open the station page, select the E. coli estimate, and read the timestamp and provisional status beside the graph. Do not treat an older value as a current measurement or interpret the display as a guarantee that a particular swimming location is safe.
Remote monitoring also appears in local utility operations. Our Willistown sewer monitoring report examines a separate system using LTE alarms and contracted service. More reporting is available in the Chester County coverage hub.
Photo: Paul Campbell on Pexels, used under the Pexels License. Illustrative stock photograph of a wooded stream. It does not depict the Downingtown station or current Chester County water conditions.
Related articles
Chester County
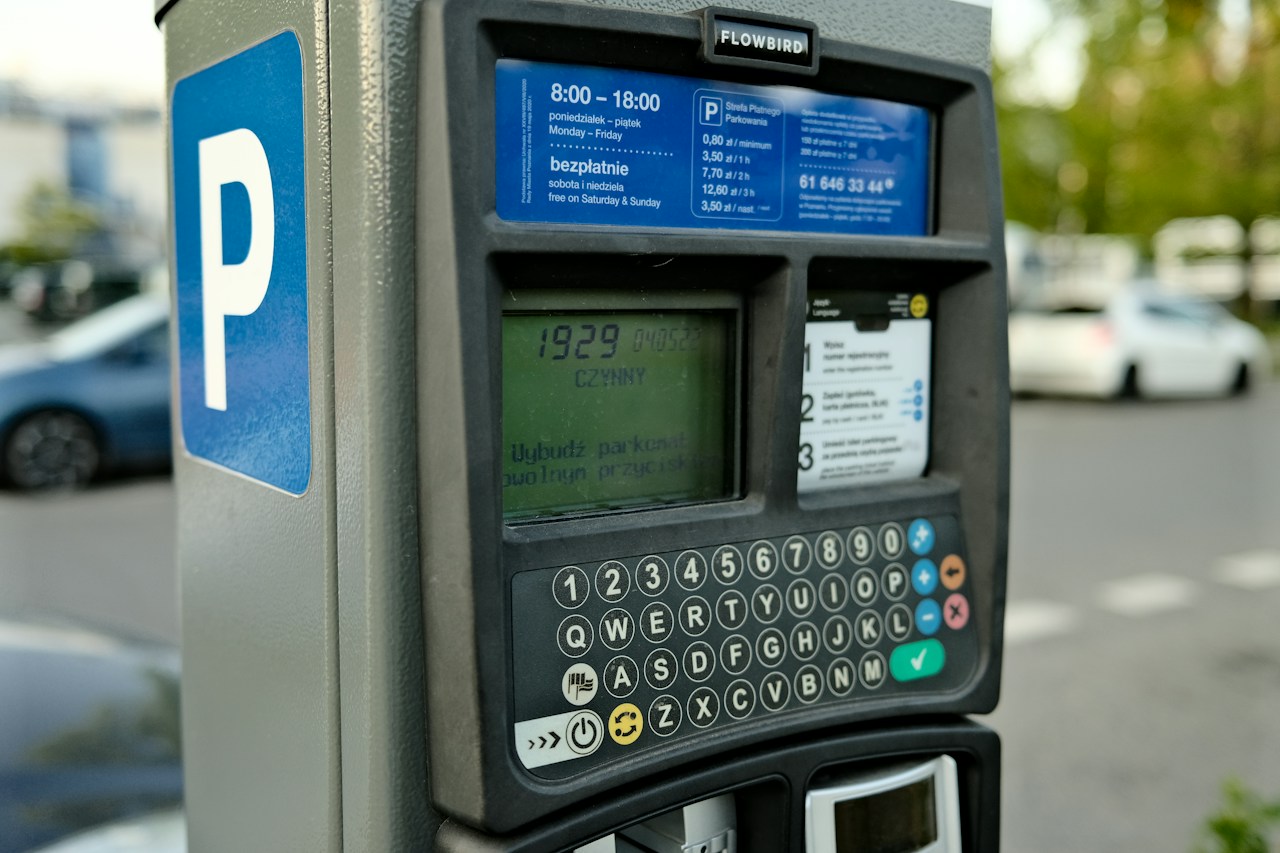
West Chester parking payments: App, kiosks and ticket help
A guide to West Chester’s ParkMobile payments, card kiosks and ticket portal, including conflicting instructions in the borough’s parking pamphlet.

Cameras and Imaging
West Chester’s 2027 drone and camera spending proposals
West Chester’s draft lists a police drone and separate camera expenses. Earlier budget records explain the grant offset behind the body camera comparison.

Chester County
Tredyffrin’s .gov transition: Website and email checks
Tredyffrin aims to finish its .gov transition by the start of 2027. Compare current township contacts with federal guidance on domains and email checks.

Chester County
Chester County’s $400,000 911 grant: What it funds
Chester County’s September 911 grant appears in the state award list. This guide compares its equipment scope with the county’s published technology inventory.